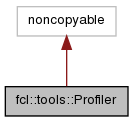
This is a simple thread-safe tool for counting time spent in various chunks of code. More...
#include <hpp/fcl/profile.h>


Classes | |
| class | ScopedBlock |
| This instance will call Profiler::begin() when constructed and Profiler::end() when it goes out of scope. More... | |
| class | ScopedStart |
| This instance will call Profiler::start() when constructed and Profiler::stop() when it goes out of scope. More... | |
Public Member Functions | |
| Profiler (bool printOnDestroy=false, bool autoStart=false) | |
| Constructor. More... | |
| ~Profiler (void) | |
| Destructor. More... | |
| void | start (void) |
| Start counting time. More... | |
| void | stop (void) |
| Stop counting time. More... | |
| void | clear (void) |
| Clear counted time and events. More... | |
| void | event (const std::string &name, const unsigned int times=1) |
| Count a specific event for a number of times. More... | |
| void | average (const std::string &name, const double value) |
| Maintain the average of a specific value. More... | |
| void | begin (const std::string &name) |
| Begin counting time for a specific chunk of code. More... | |
| void | end (const std::string &name) |
| Stop counting time for a specific chunk of code. More... | |
| void | status (std::ostream &out=std::cout, bool merge=true) |
| Print the status of the profiled code chunks and events. More... | |
| bool | running (void) const |
| Check if the profiler is counting time or not. More... | |
Static Public Member Functions | |
| static Profiler & | Instance (void) |
| Return an instance of the class. More... | |
| static void | Start (void) |
| Start counting time. More... | |
| static void | Stop (void) |
| Stop counting time. More... | |
| static void | Clear (void) |
| Clear counted time and events. More... | |
| static void | Event (const std::string &name, const unsigned int times=1) |
| Count a specific event for a number of times. More... | |
| static void | Average (const std::string &name, const double value) |
| Maintain the average of a specific value. More... | |
| static void | Begin (const std::string &name) |
| Begin counting time for a specific chunk of code. More... | |
| static void | End (const std::string &name) |
| Stop counting time for a specific chunk of code. More... | |
| static void | Status (std::ostream &out=std::cout, bool merge=true) |
| Print the status of the profiled code chunks and events. More... | |
| static bool | Running (void) |
| Check if the profiler is counting time or not. More... | |
This is a simple thread-safe tool for counting time spent in various chunks of code.
This is different from external profiling tools in that it allows the user to count time spent in various bits of code (sub-function granularity) or count how many times certain pieces of code are executed.
|
inline |
Constructor.
It is allowed to separately instantiate this class (not only as a singleton)
References start().
|
inline |
Destructor.
References status().
|
inlinestatic |
Maintain the average of a specific value.
References average(), and Instance().
| void fcl::tools::Profiler::average | ( | const std::string & | name, |
| const double | value | ||
| ) |
Maintain the average of a specific value.
Referenced by Average().
|
inlinestatic |
Begin counting time for a specific chunk of code.
References begin(), and Instance().
| void fcl::tools::Profiler::begin | ( | const std::string & | name | ) |
Begin counting time for a specific chunk of code.
Referenced by Begin(), and fcl::tools::Profiler::ScopedBlock::ScopedBlock().
|
inlinestatic |
Clear counted time and events.
References clear(), and Instance().
| void fcl::tools::Profiler::clear | ( | void | ) |
Clear counted time and events.
Referenced by Clear().
|
inlinestatic |
Stop counting time for a specific chunk of code.
References end(), and Instance().
| void fcl::tools::Profiler::end | ( | const std::string & | name | ) |
Stop counting time for a specific chunk of code.
Referenced by End(), and fcl::tools::Profiler::ScopedBlock::~ScopedBlock().
|
inlinestatic |
Count a specific event for a number of times.
References event(), and Instance().
| void fcl::tools::Profiler::event | ( | const std::string & | name, |
| const unsigned int | times = 1 |
||
| ) |
Count a specific event for a number of times.
Referenced by Event().
|
static |
|
inline |
Check if the profiler is counting time or not.
Referenced by Running().
|
inlinestatic |
Check if the profiler is counting time or not.
References Instance(), and running().
|
inlinestatic |
Start counting time.
References Instance(), and start().
| void fcl::tools::Profiler::start | ( | void | ) |
Start counting time.
Referenced by Profiler(), fcl::tools::Profiler::ScopedStart::ScopedStart(), and Start().
|
inlinestatic |
Print the status of the profiled code chunks and events.
Optionally, computation done by different threads can be printed separately.
References Instance(), and status().
| void fcl::tools::Profiler::status | ( | std::ostream & | out = std::cout, |
| bool | merge = true |
||
| ) |
Print the status of the profiled code chunks and events.
Optionally, computation done by different threads can be printed separately.
Referenced by Status(), and ~Profiler().
|
inlinestatic |
Stop counting time.
References Instance(), and stop().
| void fcl::tools::Profiler::stop | ( | void | ) |
Stop counting time.
Referenced by Stop(), and fcl::tools::Profiler::ScopedStart::~ScopedStart().