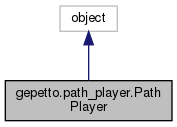
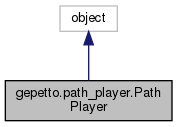
displays a path by sampling configurations along the path.
More...
|
| def | __init__ (self, publisher, client=None, dt=0.01, speed=1) |
| |
| def | setDt (self, dt) |
| |
| def | setSpeed (self, speed) |
| |
| def | __call__ (self, pathId) |
| |
| def | displayPath (self, pathId, color=[0.85, jointName=0) |
| | Display the path of the desired joint By default, display the path of the root. More...
|
| |
| def | displayVelocityPath (self, pathId, jointName=0) |
| | Display the path with a color variation according to the velocity along the path green for velocity close to 0, red for velocity close to the velocity bound. More...
|
| |
| def | generatePlot (self, pathId, play=False, jointNames=None, cursor=False, filename=None) |
| | Generate a plot with the following datas: More...
|
| |
| def | toFile (self, pathId, fname) |
| |
| def | toFileAppend (self, pathId, fname) |
| |
| def | getTrajFromFile (self, fname) |
| |
| def | fromFile (self, fname) |
| |
displays a path by sampling configurations along the path.
◆ __init__()
| def gepetto.path_player.PathPlayer.__init__ |
( |
|
self, |
|
|
|
publisher, |
|
|
|
client = None, |
|
|
|
dt = 0.01, |
|
|
|
speed = 1 |
|
) |
| |
◆ __call__()
| def gepetto.path_player.PathPlayer.__call__ |
( |
|
self, |
|
|
|
pathId |
|
) |
| |
◆ displayPath()
| def gepetto.path_player.PathPlayer.displayPath |
( |
|
self, |
|
|
|
pathId, |
|
|
|
color = [0.85, |
|
|
|
jointName = 0 |
|
) |
| |
Display the path of the desired joint By default, display the path of the root.
◆ displayVelocityPath()
| def gepetto.path_player.PathPlayer.displayVelocityPath |
( |
|
self, |
|
|
|
pathId, |
|
|
|
jointName = 0 |
|
) |
| |
Display the path with a color variation according to the velocity along the path green for velocity close to 0, red for velocity close to the velocity bound.
This method assume that the path is represented by instances of the KinodynamicPath class
◆ fromFile()
| def gepetto.path_player.PathPlayer.fromFile |
( |
|
self, |
|
|
|
fname |
|
) |
| |
◆ generatePlot()
| def gepetto.path_player.PathPlayer.generatePlot |
( |
|
self, |
|
|
|
pathId, |
|
|
|
play = False, |
|
|
|
jointNames = None, |
|
|
|
cursor = False, |
|
|
|
filename = None |
|
) |
| |
Generate a plot with the following datas:
- abscissa: time.
- ordinate: parameter values of the joint names.
If play is True, the path is played when the data to be plotted are generated.
If cursor is True, filename must be a string which will be formatted with one integer (frame index). For each frame, a cursor is drawn at the current time and the plot is written to the formatted filename.
If cursor is False, only one plot is generated. Then,
- If filename is None, the plot is shown in a new window;
- If filename is a string, the plot is written to filename.
◆ getTrajFromFile()
| def gepetto.path_player.PathPlayer.getTrajFromFile |
( |
|
self, |
|
|
|
fname |
|
) |
| |
◆ setDt()
| def gepetto.path_player.PathPlayer.setDt |
( |
|
self, |
|
|
|
dt |
|
) |
| |
◆ setSpeed()
| def gepetto.path_player.PathPlayer.setSpeed |
( |
|
self, |
|
|
|
speed |
|
) |
| |
◆ toFile()
| def gepetto.path_player.PathPlayer.toFile |
( |
|
self, |
|
|
|
pathId, |
|
|
|
fname |
|
) |
| |
◆ toFileAppend()
| def gepetto.path_player.PathPlayer.toFileAppend |
( |
|
self, |
|
|
|
pathId, |
|
|
|
fname |
|
) |
| |
◆ client
| gepetto.path_player.PathPlayer.client |
◆ dt
| gepetto.path_player.PathPlayer.dt |
◆ end
| gepetto.path_player.PathPlayer.end |
◆ publisher
| gepetto.path_player.PathPlayer.publisher |
◆ speed
| gepetto.path_player.PathPlayer.speed |
◆ start
| gepetto.path_player.PathPlayer.start |
◆ tau
| gepetto.path_player.PathPlayer.tau |
The documentation for this class was generated from the following file:


